to graph tree circles in the PICTORIALs
The Garden of Eden Project
-- 2021 UPDATE --
So now imagine it....your little dome-like house (maybe like this one?)
would be in the middle of concentric circles of fruit and nut trees as is shown in the PICTORIALs, but each circle
would be a different TYPE of tree and each type of tree has a different recommended PLANTING DISTANCE so it could get
VERY COMPLICATED to figure out where to plant each circular row of trees, especially if you want to design a big piece
of land of your own, as I have done here!
I have used geometric sine and cosine functions in these equations (@SIN and @COS). I am not going to go into a
complete explanation of how to use sine, and cosine (nor tangent, for that matter). You can look it up online if you
need to know more. However my explanations should be fairly thorough. I will talk more about that later when I
explain each part of the equation.
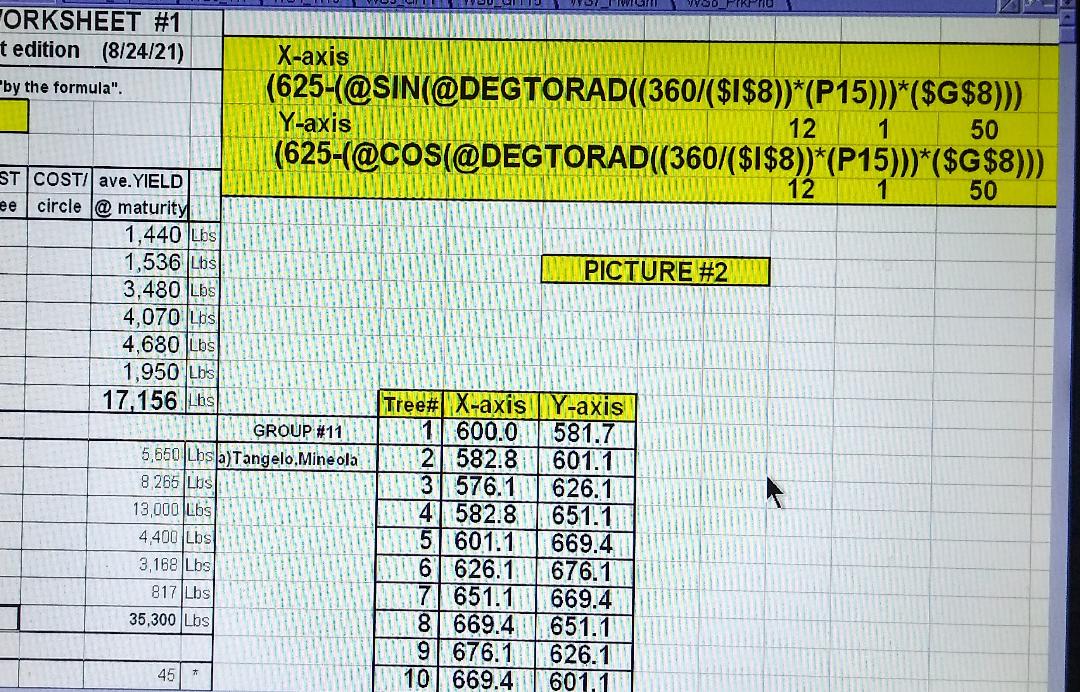
X-AXIS EQUATION
(625-(@SIN(@DEGTORAD(360/$I$8)*(P15))) X ($G$8)) = 600
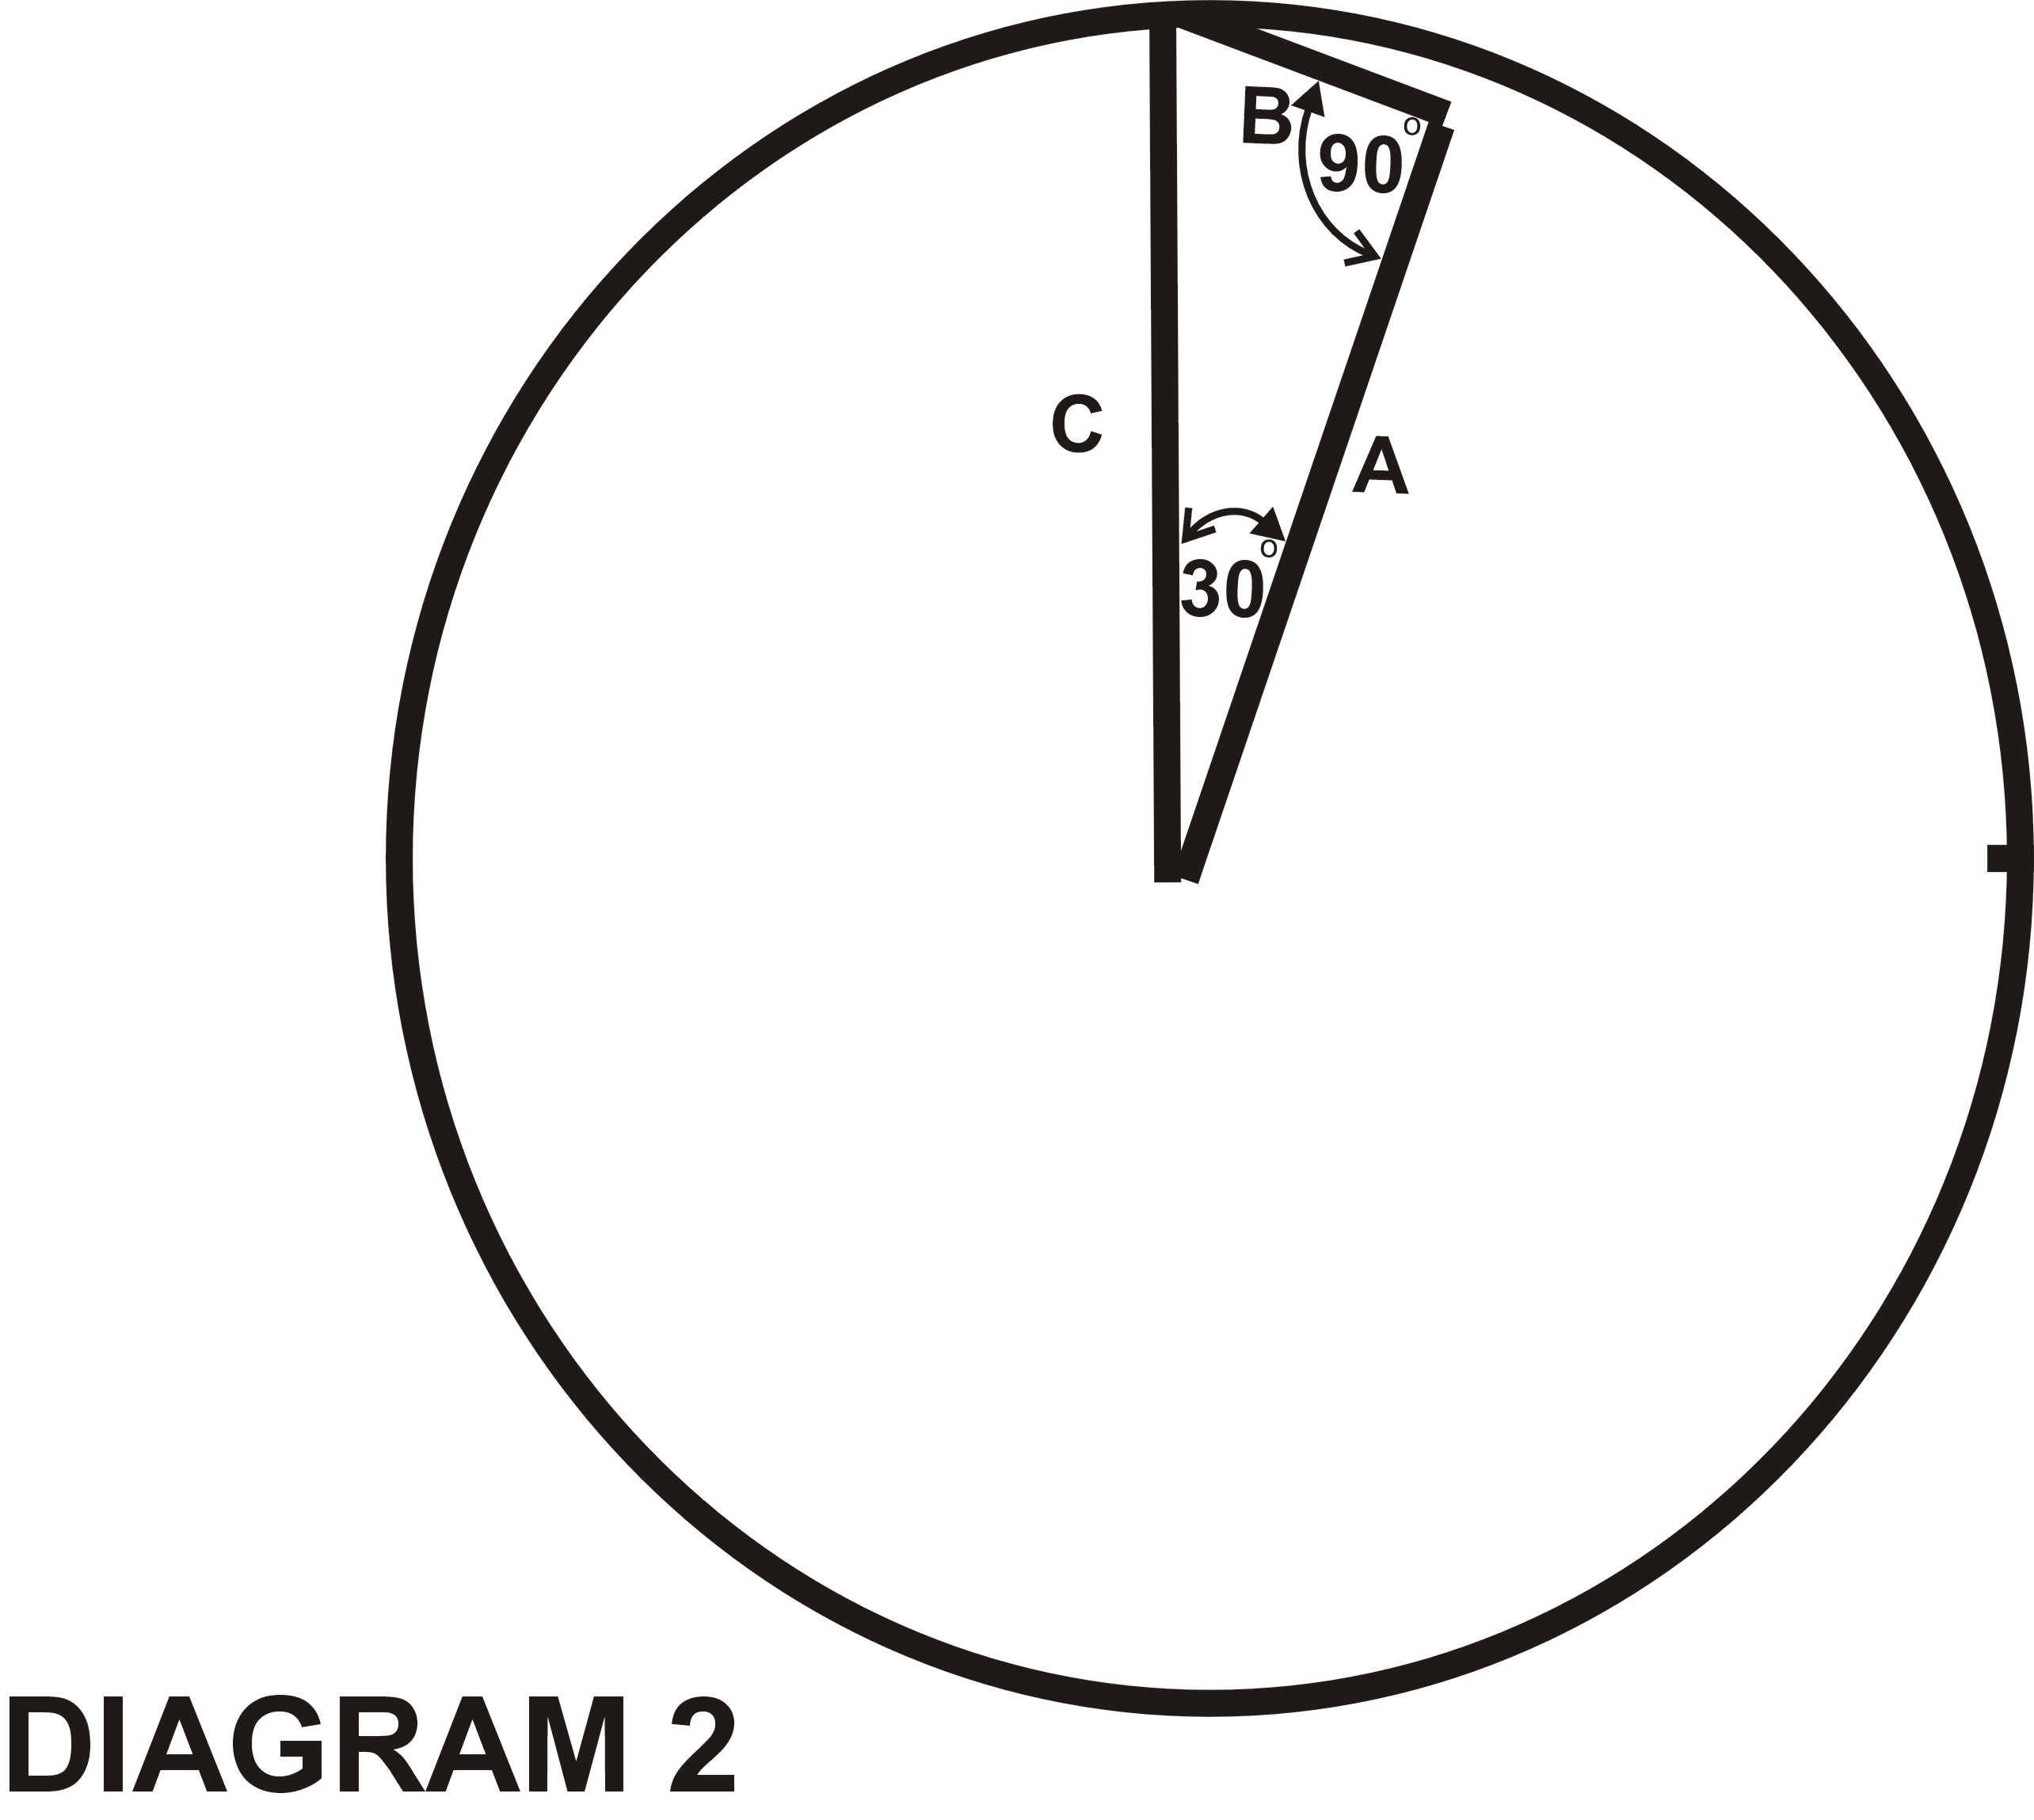
This then will be the hypotenuse (the side opposite the [90-degree] angle). The length of this line also happens to be the
length of the radius of the circle (DIAGRAM #2). In our triangle, another side of the triangle also starts from the center
of the circle. The angle between the hypotenuse and this just-mentioned side, is the same as the angle calculated a few
paragraphs above or 30 degrees. (It may seem kind of strange that we have to deal with with these upside down triangles
and such as shown in the DIAGRAMS, but this is how the computer “thinks”.)
Y-AXIS EQUATION
(625-(@COS(@DEGTORAD(360/$I$8)*(P15))) X ($G$8)) = 581.7
WORKSHEET #1 DATA
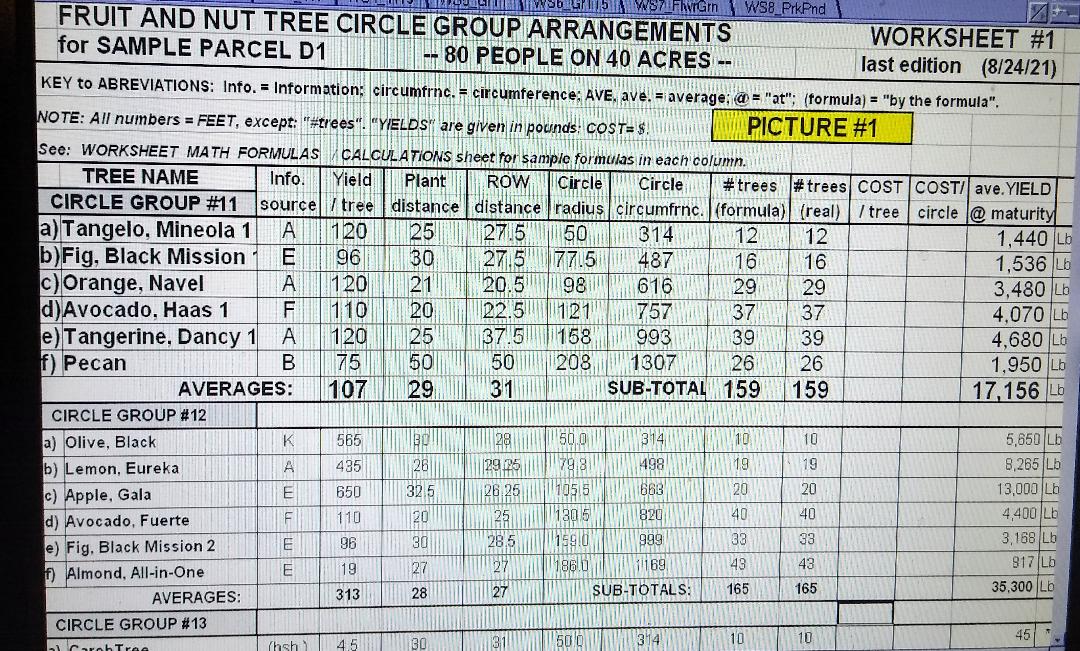
Looking again at the PICTURE #1 spreadsheet (aka WORKSHEET #1), you may want to know about the other columns in this
worksheet, not mentioned above. For our sample we will again use the formulas for the 1st row of trees, in CIRCLE GROUP
#11, the “Tangelo, Minneola 1” row.
Recommended books:
1) "Rodale's Book of Organic Gardening" Rodale Press
2) "Carrots Love Tomatoes" by Louise Riotte
3) "The Owner Built Homestead" by Ken & Barbara Kern
So this is where I will show you how I figured all this stuff out so that in case you want to put different types of
trees OTHER than what I have shown in the PICTORIAL designs, you can more easily substitute YOUR choice of trees in the
design and then see how it will look to make sure it will fit on your land area while planting the different types of
trees the correct distance apart so that each tree can reach its full potential without crowding other trees. Then also
you can recalculate how much fruit you will get from your new design.
So you will need to find out the recommended planting distances for each different type of tree that you are going to
have. These numbers can be obtained from your local nursery where you will also find the different types of trees that
will grow in your geographical region where you wil be planting your own Garden of Eden. You will probably also want to
find out the average yield at maturity for the different trees you will have so you will have some idea how much food
you might produce.
In order to create the circles of FRUIT TREES (represented by GREEN DOTS) as shown in the PICTORIALs on this website,
I originally used a spreadsheet program called Lotus 1-2-3 Release 9 for Windows. This program is about 20 years old
but hopefully it should be similiar enough to whatever spreadsheet program you will be using. The newer spreadsheet
programs are all based on the older ones anyway, so it should be similiar enough.
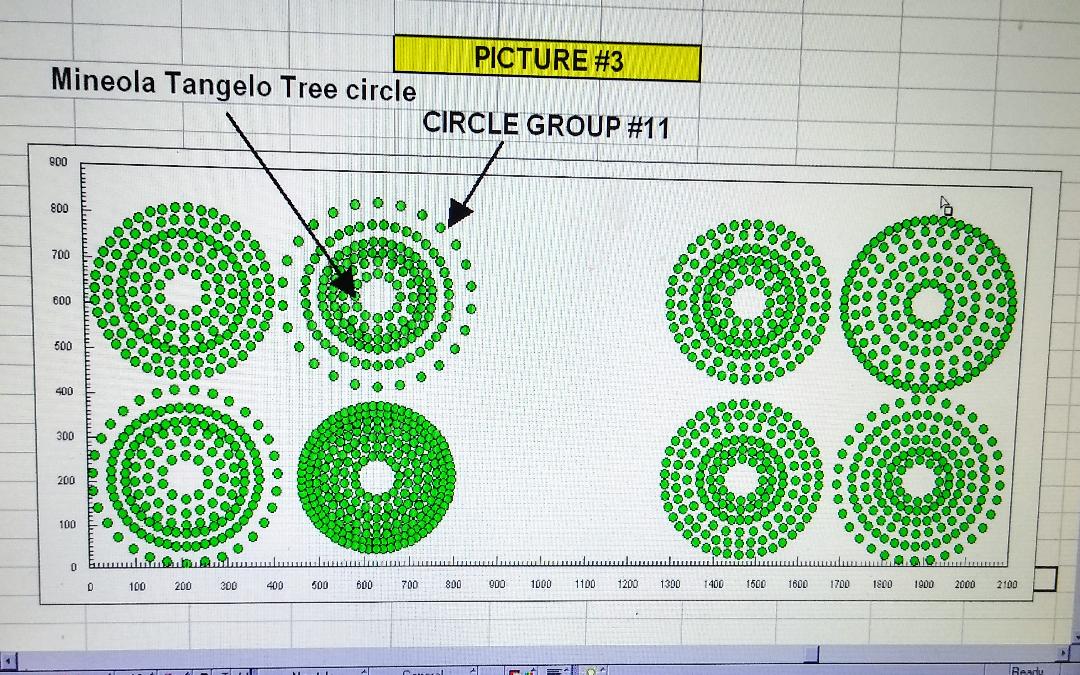
Look at PICTUREs #1, #2 and #3 below. All 3 PICTURES are from the same page on the spreadsheet. PICTURE #1 is the left
side of the spreadsheet and shows some of the data I used to graph these green dots. PICTURE #2 is to thr right of
PICTURE #1 and shows the formulas used to make the graphs of the circles of trees and PICTURE #3, to the right of PICTURE #2,
shows the graphs of the green circles of dots created from the spreadsheet data. I used PICTORIAL D1 (from the 40 ACRE
DESIGN link on the homepage) CLICK HERE as the example in the explanation below.
As I describe the geometry formulas below refer to these pictures as needed. I apologize for the strange wavy lines in
the pictures.
Before I begin my explanation, I will tell you a few things about the Lotus 1-2-3 Release 9 for Windows spreadsheet
program that I used:
1) This computer application was capable of making “graphs” (as seen in PICTURE #3) from any 2 “selected” sets
of numbers in the COLUMNS of cells, as shown in PICTURE #2. Presumably the program you are using can do this also.
2) This “Lotus” application provided 12 different types of graphs to choose from. Graphs can often be customized to
suit your tastes. I chose the “X - Y scatter” graph because I felt it would be the easiest to work with, and because
it is very much like the “X” and “Y” coordinate axes in geometry and made nice circles of dots.
So now let’s look again at PICTURE #1 (also called WORKSHEET #1). You can see here how I have laid out the basic
information in this spreadsheet. Go down a few lines from the top until you see TREE NAME and under that CIRCLE
GROUP #11. Under that you will see 6 types of trees. These are the trees in CIRCLE GROUP #11. Now look at PICTURE
#3. You will see here 8 groups of circles of green dots. These are graphic representations of all the trees for the
entire PICTORIAL D1. You will see the arrow with text showing which group of circles is CIRCLE GROUP #11. You will
see 6 different sized concentric circles within CIRCLE GROUP #11 which corresponds to the 6 types of trees on the
spreadshhet mentioned here. The innermost circle of GROUP #11 is the Mineola Tangelos trees, as indicated by the
arrow. (By the way, this whole graph was ultimately the starting point for PICTORIAL D1.}
Looking at the worksheet again, look at the first tree under CIRCLE GROUP #11. This is: a) Tangelo, Mineola 1.
The cells to the right of this are some of the data used in the two formulas for graphing the circles and other
purposes. We will talk more about this in greater depth further down.
So now with the basic info about the spreadsheet program I used we can start to get down to work here. Using
principles of geometry, we can use “coordinate geometry” and “X” and “Y” axes to graph the circles of dots.
The 2 sets of numbers, mentioned in 1) above, are the 2 columns of cells with numbers inside shown beneath
the PICTURE #2 label with the titles of “X-axis” and “Y-axis”.
The numbers under the “X -axis” and the “Y-axis” columns of cells, together represent the coordinates needed to
graph EACH DOT on the graph, which of course, represents a tree. These numbers are expressed in “feet”. (On the
graph itself it may only be a matter of a few centimeters or inches). The “X-axis” coordinate is the distance from
the left border of the land that the picture represents, to the tree (dot). The “Y-axis” coordinate is the distance
from the bottom border of the picture (or land border) to the same dot.
Next I will show you which formulas and equations I used to arrive at the sets of coordinate numbers in PICTURE #2.
The first formula is shown in large print at the top of the page. This is the formula that is located inside cell
number Q15 under the “X-axis” column. You will see the number 600 inside this cell, which is the result of the equation.
Here is this equation written in computer language:
And now I will substitute the numbers for the cell adresses:
(625-(@SIN(@DEGTORAD(360/12)*(1))) X (50)) = 600
And now I will show it in a more familiar mathematical formula:
(625 - (sine of ((360/12) X (1))) X (50)) = 600
Now I will go through each part of the formula to expain it.
625 is the number of feet from the left side of the graph in PICTURE #3. It will also represent one of the
coordinates for the center of the circle which all the circles of trees in CIRCLE GROUP #11 use as their center.
So the rest of the equation in parentheses is subtracted from this first number to give the “X-axis” coordinate for
the first tree (dot). In order to calculate this number (position on the graph) we need to know several things.
First, in order to see where the cell addresses “$I$8", “P15" and “$G$8" come from look at PICTURE #1. Find Tangelo,
Minneola 1. The “$I$8" cell is found directly under the “# trees (formula) label. It’s actually simply I8 (in the
formula). This may look like the number “eighteen” but it’s actually an uppercase letter “I” plus an “8". The dollar
signs are merely a formula function in Lotus that enable you to copy this cell and paste it without the number or letter
changing as you paste it in other cells. I hope that doesn’t confuse you. It’s just a spreadsheet thing.
Next the “$G$8" (or simply “G8") cell address (at the end of the equation) is found under the “Circle radius”
label in the spreadsheet in PICTURE #1 and is the number 50.
The “P15" cell is found in a different location, under the PICTURE #2 label and to the left of the first
cell under the “X-axis” label and under the “Tree#” label and it is the number “1" in that cell.
Of course if you understand spreadsheets at all, you know that each cell address is composed of a letter
and a number. The LETTER represents the COLUMN that it’s in and the NUMBER represents the ROW that it’s in.
So for example “P15" would be column P, and row 15. You can actually count the cells starting at the far left
of the spreadsheet (going through the alphabet A, B. C...) to come to column P and count the numbers (1,2,3...)
down from the top of the spreadsheet tp arrive at row 15.
Next in the formula, the Lotus spreadsheet program (and maybe yours) needs to convert “degrees” into “radians”
by using the “@DEGTORAD” function in order for it to work properly.
In the formula the number 360 represents the 360 degrees in a circle. This is where we are getting into some geometry.
By the way if you have trouble understanding geometry you may be able to function well by simply usiing a formula
like the one shown in my explanation example and substitute the numbers in your own spreadsheet. Maybe that would
work for you. And I am not going to attempt to fully explain the geometric principles here. I’m sure you could find
something online for that purpose.
So now let’s take another look at the spreadsheet in PICTURE #1. Look again at the cells to the right of the Tangelo,
Mineola 1 label. The Plant distance is the number that you get from your local nursery. The ROW distance is determined
by AVERAGING the planting distances of adjacent rows. In this case the planting distance for the Tangelo is 25 feet,
as shown on the spreadsheet. The planting distance for the row under it (Black Mission Fig) is 30 feet. Therefore the
ROW distance is the AVERAGE of that, or 27.5 feet. So the formula in this cell is [(E8+Ep)/2]. The spreadsheet calculates
the ROW distances as you copy and paste it, going down to the next row in the spreadsheet.
Next, the Circle radius column is shown. We need this radius in the formula and in this case it’s the “$G$8" cell
address at the end of the formula. In the cell itself it is the number 20.
And now going back to the complete formula shown at the top of PICTURE #2
In computer language:
(625-(@SIN(@DEGTORAD(360/$I$8)*(P15))) X ($G$8)) = 600
In math language:
(625 - (sine of ((360/12) X (1))) X (50)) = 600
So now further analysis for the heart of the equation:
(the sine of ((360/12) X (1)))
360 represents the 360 degrees of a full circle that in our case represents the circular row of trees.
This number of degrees (360) is divided by 12 (the number of trees in that circle, taken from Worksheet #1,
the “trees (formula)” column):
So 360 degrees divided by 12 trees = 30 degrees for each tree
The (1) in the formula represents the 1st tree in the circle of trees, taken from the “Trees#” column (cell
P15), and is multiplied times the radius of the tree circle, 50 feet, taken from the Circle radius cell in the
spreadsheet. The circle radius starts from the center of CIRCLE GROUP #11 and extends outward to the 50 foot point.
Imagine that you are on a bare piece of land that will become your Garden of Eden. You could drive a stake in the
ground in the center of an imaginary circle, which in this case would be 625 feet from the left border of your property.
You could then tie a 50 foot piece of rope to that stake and walk out 50 feet and that might be the first place to
*plant your first tree for the circle of Mineola Tangelo trees. Then you could tie another stake to the end of that
50 foot rope and then drag the stake all the way around to make a giant 100 foot diameter circle in the dirt. Then
this giant circle would have a 50 foot radius. You would probably build your cute little dome house right in the
middle of that same circle. If your house was 50 feet in diameter (25 foot radius) then you would add
another 25 feet until you first cirlce of trees. This is just to help you visualize what we are doing here.
So, why do we use the sine of this angle in the formula above? To answer this, first we must show you something:
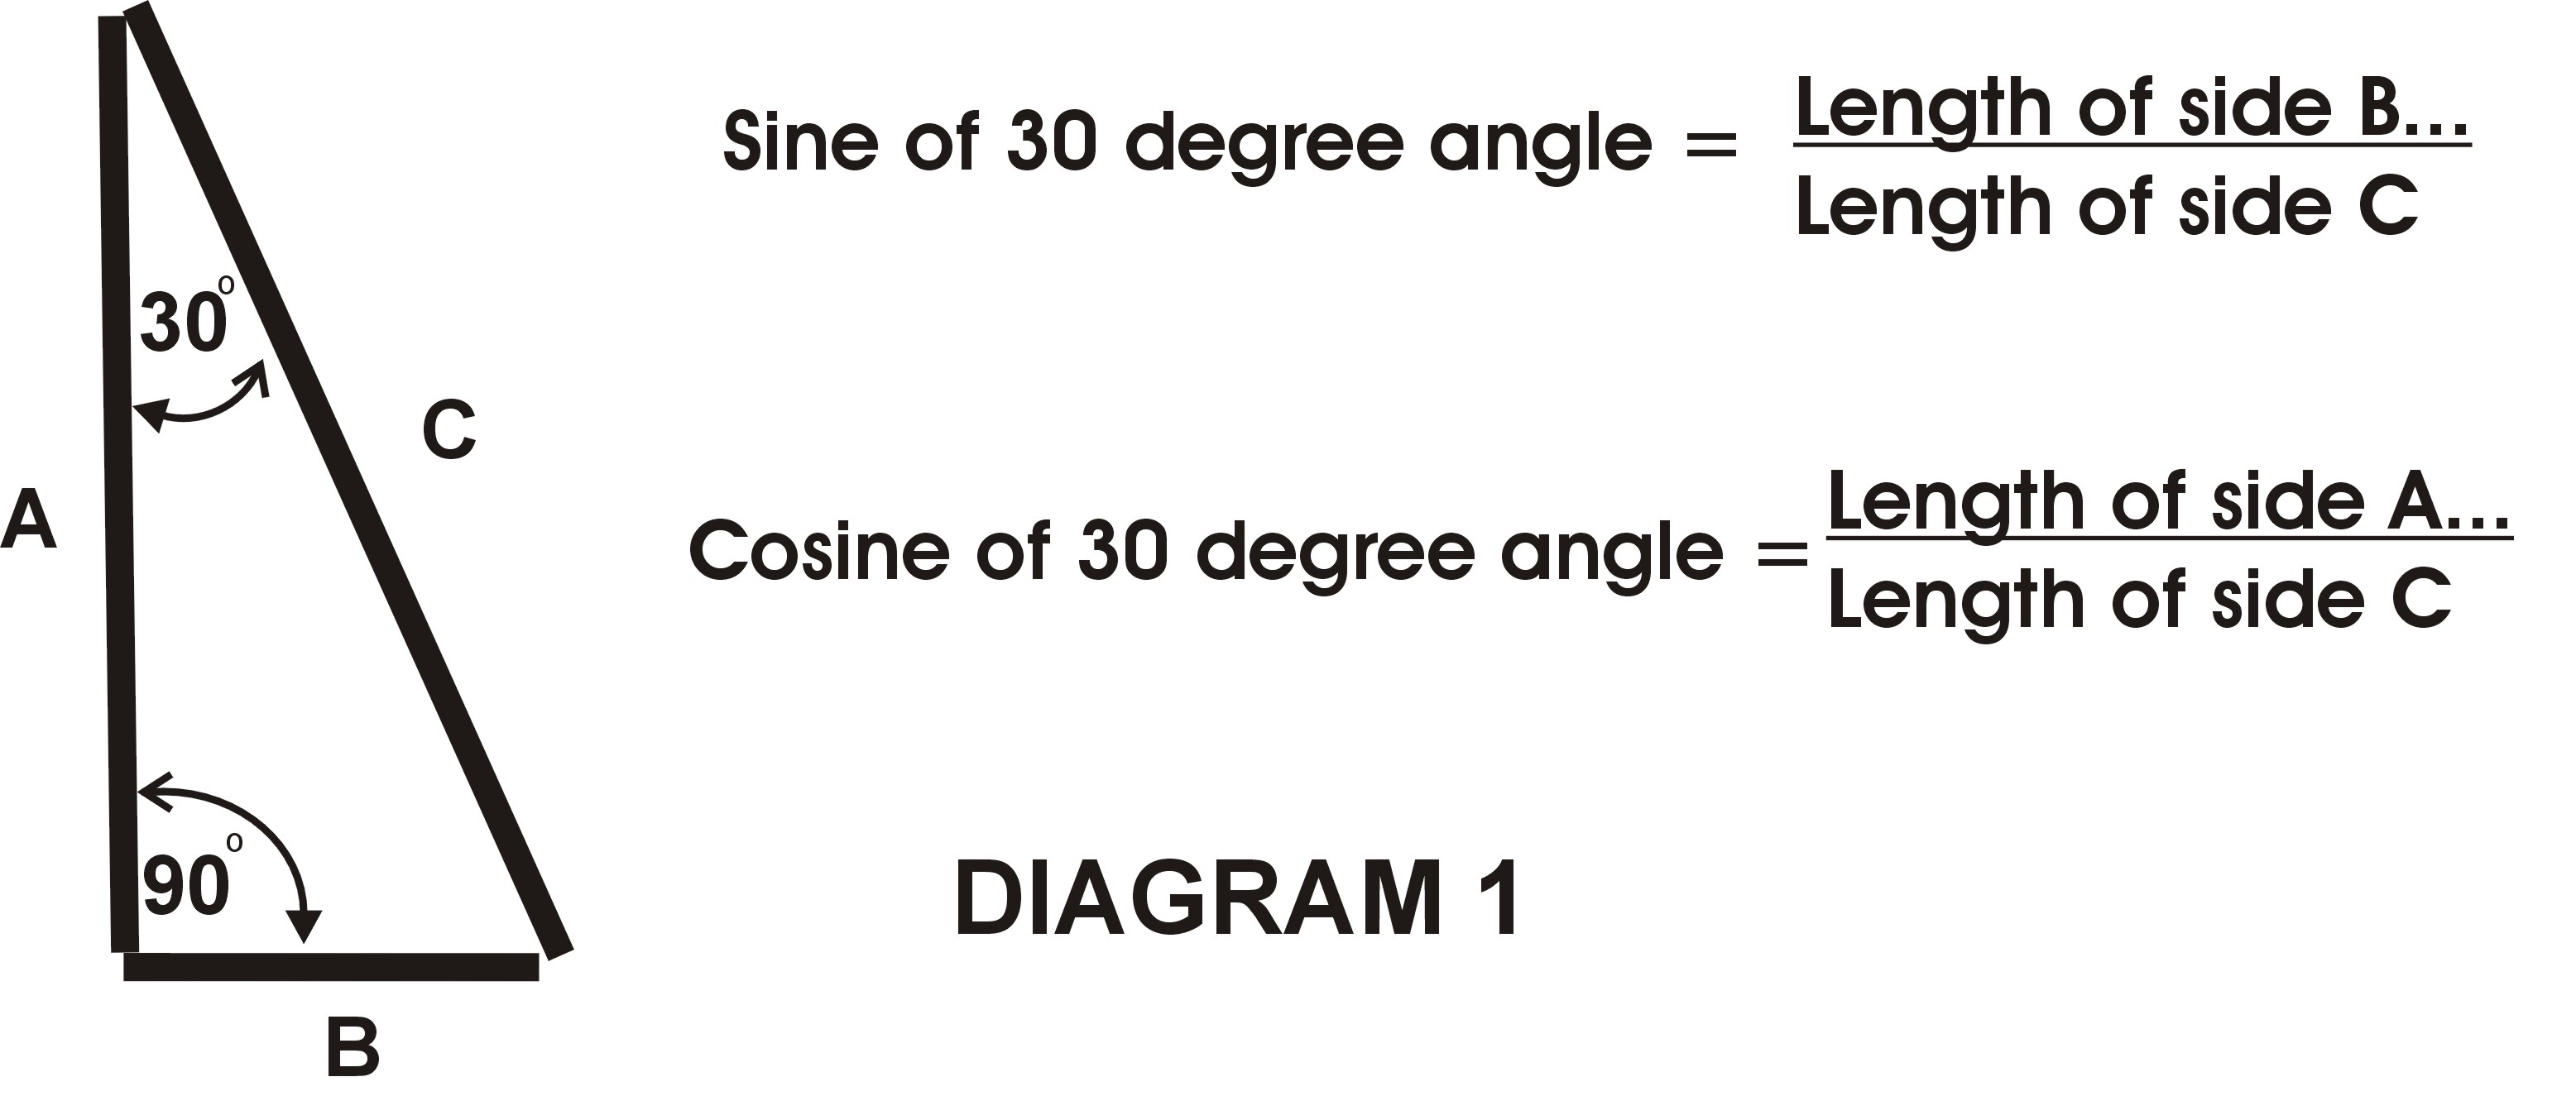
In geometry, in a circle, we can construct a “right triangle” (a triangle with one 90-degree angle as shown in DIAGRAM #1
below). The diagram shows you how sine and cosine are calculated. You may not need to know more about sine and cosine, but
if you do, look it up online.
The 3rd side of the triangle will be part of the measurement for the length of the X -axis coordinate,
when combined with 625.
Now I can show you the formula for “sine”:
sine of 30 degrees = (length of side opposite the 30 degree angle) divided by
(length of hypotenuse [also, the radius])
simplifying: sine of 30 degrees = (length of side opposite the 30 degree angle) divided by (50)
(Google the value for the sine of a 30 degree angle, and you get 0.5)
so: 0.5 = (length of side opposite the 30 degree angle) divided by (50)
rewriting the equation to find the “unknown”, i.e., the length of the side opposite the 30 degree angle:
length of side opposite the 30 degree angle = (0.5) X (50)
solving: length of side opposite the 30 degree angle = 25
3) So, now, to finish the explanation of the “X -axis” equation, we subtract the above number to get our first
number for the X-axis coordinate:
(625 - (sine of ((360/12) X (1))) X (50)) = 600
substituting: (625 - (25)) = 600
So now that we have a basic understanding of the “X-axis” equation, I will show you which formulas and equations
I used to arrive at the 2nd set of coordinate numbers in PICTURE #2, the “Y-axis” equation which is enlarged and
right underneath the first equation. Thie equation itself is found in cell R15 on the spreadsheet and the result
(581.7) is visible in the cell.
Again, for our sample, we will use the formulas for the 1st tree in the “Tangelo, Minneola 1” circle of dots (trees) as
seen in PICTURE #1 under the CIRCLE GROUP #11. Here is the equation for the “Y-axis”. You will note that the only
difference between this equation and the X-axis equation is the this has “cosine” instead of “sine” and the result
(581.7) is also different:
And now I will substitute the numbers for the cell adresses:
(625-(@COS(@DEGTORAD(360/12)*(1))) X (50)) = 581.7
And now I will show it in a more familiar mathematical formula:
(625- (cosine of ((360/12) X (1))) X (50)) = 581.7
Here is an analysis of each part of the equation:
1) The 625 is the distance on the Y-axis from the bottom edge of the picture to the center of the circle. It
happens to be the same number as in the othe requation but it is not always like this.
2) The (cosine of ((360/12) X (1))) is the heart of the equation. First of all, 360 represents the 360 degrees of a
full circle that represents a circular row of trees. This number of degrees (360) is divided by 12 (the number of
trees in that circle, taken from Worksheet #1, the “trees (form.)” column):
360 degrees = 30 degrees per tree (divided by)12 trees
The (1) represents the 1st tree in the circle of trees, is taken from PICTURE #2 lable, the “Tree#” column, and is
multiplied times the angle (30 degrees). (so, therefore, the angle of the 2nd tree in this circle is 60 degrees,
and so on.)
So, why do we use the cosine of this angle? Again refer to DIAGRAM #1 and #2, above. Cosine is very similiar to sine.
The formulas in DIAGRAM #1 will show you the difference.
So again we can construct a “right triangle” (a triangle with one 90-degree angle). In our case, we will construct
a right triangle within our circle drawing a straight line from the center of the circle until it meets the circle
itself. This will be the hypotenuse (the side opposite the right [90-degree] angle of the right triangle). The length
of this line also happens to be the length of the radius of the circle. In our triangle, another side of the triangle
also starts from the center of the circle. The angle between the hypotenuse and this just-mentioned side, is the same
as the angle calculated above.
This 2nd side of the right triangle will be part of the measurement of the length of the Y -axis coordinate, when
combined with 625.
Now I can show you the formula for “cosine”:
cosine of 30 degrees =
(length of side next to the 30 degree angle, making the 30 degree angle with the hypotenuse) divided by
(length of hypotenuse [also, radius])
simplifying:
cosine of 30 degrees =
(length of side next to the 30 degree angle, making the 30 degree angle with the hypotenuse) divided by (50)
(Google the value for the cosine of a 30 degree angle, and you get 0.866)
so: 0.866 = (length of side next to the 30 degree angle, making the 30 degree angle with the
hypotenuse) divided by (50)
rewriting the equation to find the “unknown”:
(length of side next to the 30 degree angle, making the 30 degree angle with the hypotenuse) = (0.866) X (50)
solving: (length of side next to the 30 degree angle, making the 30 degree angle with the hypotenuse) = 43.3
3) So, now to finish the explanation of the “Y-axis” equation, we subtract the above number to get our first number
for the Y-axis coordinate:
(625 - (cosine of ((360/12) X (1))) X (50)) = 581.7
substituting: (625 - (43.3)) = 581.7
So after finishing the graph for all the trees in the spreadsheet program, I then pasted this graph into a CorelDraw
(version 9) graphics program and then modified it into the PICTORIAL D1 that you see on the website.
The data for the “Yield / tree” and the “Plant dist.” columns are derived from the “California Statistical Abstract”
1992, California Dept. of Finance and other sources.
The “Yield / tree” is given in pounds (weight) and the “Plant distance” is the recommended distance between the same
type of tree, given in feet.
A.) As mentioned earlier, the first calculation, the first formula used (starting from the left and going right)
is for the “ROW distance” column (for Tangelo, Minneola 1):
[“ROW distance” (of row “a”)] =
[the “Plant distance” (of row “a”)] + [the “Plant distance”(of row “b”)] divided by 2
substituting: 27.5 = (25 + 30) divided by 2
NOTE: the “ROW distance” for the last (outer) circle of trees (in this case, the “Pecan” trees), is simply
the “Plant distance” itself, divided by 2.
B.) The next formula / calculation is for the “Circle radius” column. For this calculation we start by using the
initial diameter of the innermost circle which represents the outer edge of the DOME HOUSE area (the white circle
with the “11" in the center of it) PLUS the “lawn” area, outside of the house, as shown in PICTORIAL D1.
CLICK HERE Since the radius of a circle is ½ the diameter:
radius = (½) X (the diameter)
therefore, substituting:
50 feet = (½) X (100 feet)
The “Circle radius” for the Pecan circle of trees is calculated by adding the “ROW distance” number from the
preceding circle (in this case, the “Tangerine, Dancy 1” circle) to the “Circle radius” of the preceding circle.
[“Circle radius” (of “f”)] = [“Circle radius” of (of “f”)] + [“ROW distance” (of “e”)]
substituting: 245.5 = 208 + 37.5
C.) Next you will need to know how to calculate the “Circle circumfrnc.” numbers column for Tangelo, Minneola 1.
The geometric formula for the circumference (distance around) of a circle is:
circumference of a circle = (pi~3.14159) X (radius) X (2)
substituting: “Circle circumfrnc.” = (pi~3.14159) X (“Circle radius”) X (2)
substituting for “Tangelo, Minneola 1": 314 = (3.14159) X (50) X (2)
D.) The 4th formula is for the “trees (formula)” column. This calculates the number of trees in each circle of
trees (rounded off to the nearest whole number, since there can be no fraction of a tree), using “Plant distance”and
“Circle circumfrnc.” columns:
“trees (formula)” = “Circle circmfrnc.” divided by “Plant distance”
substituting: 12 = 314 divided by 25
E.) The “trees (real)” formula was created to be used where there are incomplete circles of trees. (As in the case,
for example, where the outer circle of trees would intersect with another circle of trees.) I simply moved the
formulas for the unwanted trees from the 2 “selected” columns that “graph” all the numbers within the “selected”
areas (the “X-axis” and the “Y-axis” columns). This “trees (real)” formula is what I use to calculate the “ave.
Yield @ matur.” column of numbers, described in “G.)”, below.
F.) The “COST / tree” and “COST / circle” columns obviously have not been used yet and of course are to calculate the
cost of the trees.
G.) The “ave. Yield @ maturity” column is used to calculate the approximate yield, in pounds, of the fruit, for
each circle of trees, at the approximate maturity of the tree. This, of course, is just an average estimate. The
formula is:
“ave. Yield @ maturity” = [“trees (formula)”] X [“Yield / tree”]
substituting: 1,440 = (12) X (120)
That’s it! Good luck with all of this! I hope your own Garden of Eden turns out fantasic!